
MEMORANDUM
Date: November 23, 2016
To: Greg Hart, COO
From: Richard Peterson, Research Analyst
Subject: Predicting Flight Arrival Delay from Departure Delay
At our meeting on November 16th, while we were discussing the preliminary analysis of the arrival and departure data, you asked if we might be able to use that data to predict arrival times based on departure times. We reanalyzed the data for this purpose and want to share the results.
In this data set a change in departure delay has a high positive correlation to a change in arrival delay, 0.90 on a scale of -1.0 to +1.0. While the two are closely related, this alone does not prove causality or provide a measurement of predictability. For this, we conducted a statistical test called a regression analysis of the departure and arrival delays of the 444 random flights—169 United and 275 American—from LAX to JFK over a one year period. The analysis creates a formula from the data that best expresses the dependence of any arrival time based on that airplane’s departure time. We can use this formula to predict arrival times. The formula has two parts: 1) the arrival time in minutes saved (or lost) when the airplane departs on time, and 2) the weight or impact that each minute of departure delay has on arrival delay.
The analysis of this limited data set reveals that: 1) when airplanes depart on time they are likely to arrive about four minutes (4:07 minutes) earlier than scheduled, and 2) for every minute of departure delay there is approximately one minute (0:57 seconds) of arrival delay. For any given departure delay, say, 20 minutes, we can predict the arrival delay as: 4:07 minutes of early arrival + the weight of 0.96 times the 20 minute departure delay or approximately 15 minutes of arrival delay. The departure-arrival relationship of each of the 444 flights is depicted in the chart on the next page. This scatterplot chart (Figure 1) shows the linear relationship by drawing an ideal line through the data with the least amount of distance from all of the data points. The line through the dots representing individual airplane data is called the regression line and it is drawn by applying a formula to all of the data that mathematically minimizes the distance or variation.
The regression statistics also provide an estimate of the accuracy of the formula using two measures. The first measure is an indication of how much of the arrival delay is explained by the departure delay. In this data that measure is 82%, which means that 18% of arrival delays are due to factors other than departure delays. The other measure of accuracy is the range, and we can expect to see a range of 33 minutes (plus or minus 17 minutes of arrival delay around the regression line) for any given departure delay. This variation due to “other” factors is considerably less than if we were to make an arrival time estimate without using regression analysis.
American and United: Predicting Arrival Delay
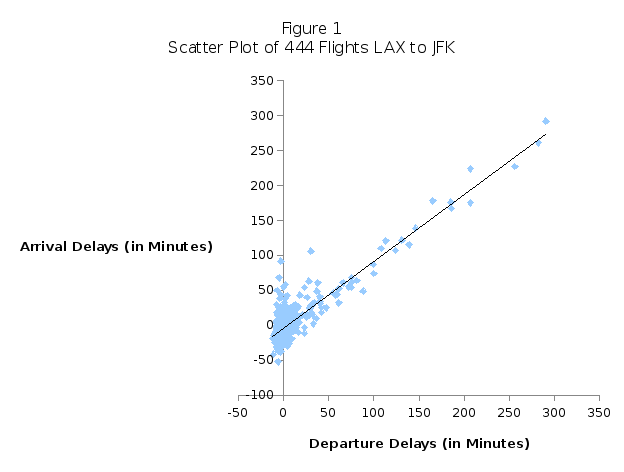
y = 0.9558x – 4.1144
Multiple R = 0.9
R² = 0.8164
Std Error = 16.7
P value = 0.002288
Finally, the regression statistics include a measure of reliability. Our data approaches 100% reliability; meaning, if we were to collect the sample data again, we would have the same regression statistics.
While we need data on more flight delays to and from more airports, the early indication is that we will be able to predict arrival delays based on departure delays with considerable accuracy and reliability. We look forward to receiving a more comprehensive data set on which we could repeat this analysis.
If you have any questions or comments please contact us.


Delivering a high-quality product at a reasonable price is not enough anymore.
That’s why we have developed 5 beneficial guarantees that will make your experience with our service enjoyable, easy, and safe.
You have to be 100% sure of the quality of your product to give a money-back guarantee. This describes us perfectly. Make sure that this guarantee is totally transparent.
Read moreEach paper is composed from scratch, according to your instructions. It is then checked by our plagiarism-detection software. There is no gap where plagiarism could squeeze in.
Read moreThanks to our free revisions, there is no way for you to be unsatisfied. We will work on your paper until you are completely happy with the result.
Read moreYour email is safe, as we store it according to international data protection rules. Your bank details are secure, as we use only reliable payment systems.
Read moreBy sending us your money, you buy the service we provide. Check out our terms and conditions if you prefer business talks to be laid out in official language.
Read more